Introduction
Pedestrian detection is challenging when multiple pedestrians are close in space. Firstly, a single-pedestrian detector tends to combine the visual cues from different pedestrians as the evidence of seeing a pedestrian and thus the detection result will drift. As a result, nearby pedestrian-existingwindows with lower detection scores will be eliminated by nonmaximum suppression (NMS).Secondly, when a pedestrian is occluded by another nearby pedestrian, its detection score may be too low to be detected.
On the other hand, the existence of multiple nearby pedestrians forms some unique patterns which do not appear on isolated pedestrians. They can be used as extra visual cues to refine the detection result of single pedestrians.
The motivations of this paper are two-folds:
- It is recognized by sociologists that nearby pedestrians walk in groups and show particular spatial patterns.
- From the viewpoint of computer vision, these 3D spatial patterns of nearby pedestrians can be translated into unique 2D visual patterns resulting from the perspective projection of 3D pedestrians to 2D image. These unique 2D visual patterns are easy to detect and are helpful for estimating the configuration of multiple pedestrians.
Contribution Highlights
- A multi-pedestrian detector is learned with a mixture of deformable part-basedmodels to effectively capture the unique visual patterns appearing in multiple nearby pedestrians. The training data is labeled as usual, i.e. a bounding box for each pedestrian. The spatial configuration patterns of multiple nearby pedestrians are learned and clustered into mixture component.
- In the multi-pedestrian detector, each single pedestrian is specifically designed as a part, called pedestrian-part.
- A new probabilistic framework is proposed to model the configuration relationship between results of multi-pedestrian detection and 1-pedestrian detection. With this framework, multi-pedestrian detection results are used to refine 1-pedestrian detection results.
Citation
If you use our codes or dataset, please cite the following papers:
- W. Ouyang and X. Wang. Single-pedestrian detection aided by multi-pedestrian detection. In CVPR, 2013. PDF
Images
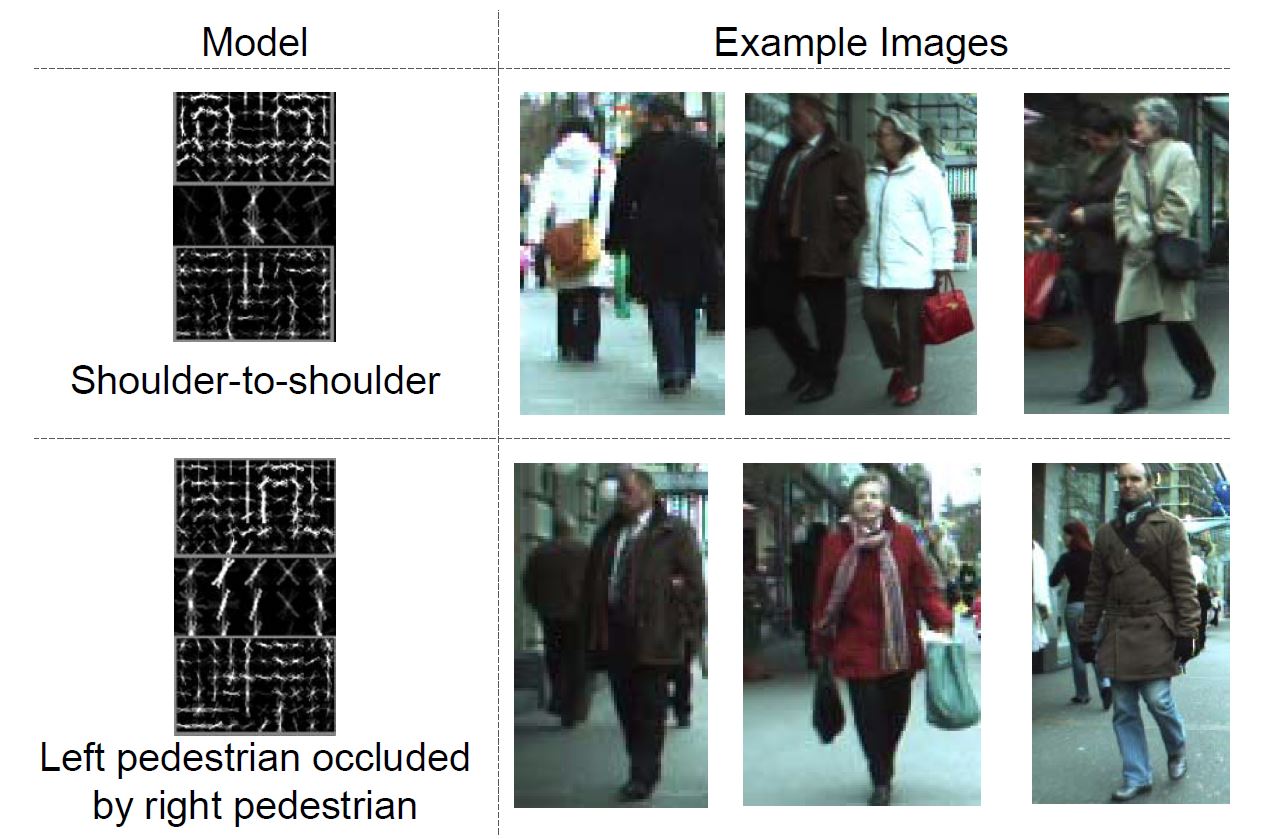
Visual patterns learned from training data with the HOG feature (first column) and examples detected from testing data (remaining columns). In the first row, pedestrians walk side by side. In the second row, pedestrians on the left are occluded by pedestrians on the right.
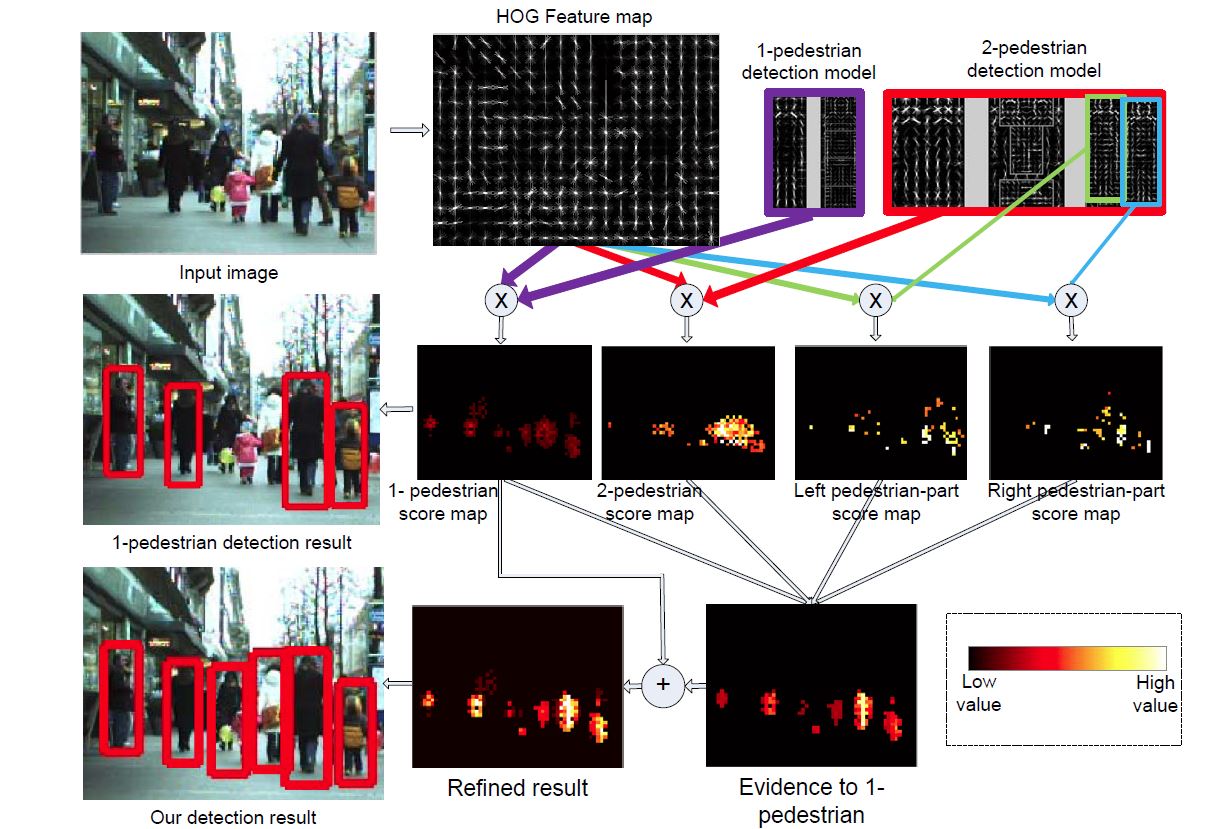
Use 2-pedestrian detection result to refine 1-pedestrian detection. The detection scores of 1-pedestrian, 2-pedestrians and pedestrian-parts are integrated as the evidence to 1-pedestrian configuration z1. This evidence is added to the result obtained with the 1-pedestrian detector. Examples in the left column are obtained at 1FPPI on the ETH dataset
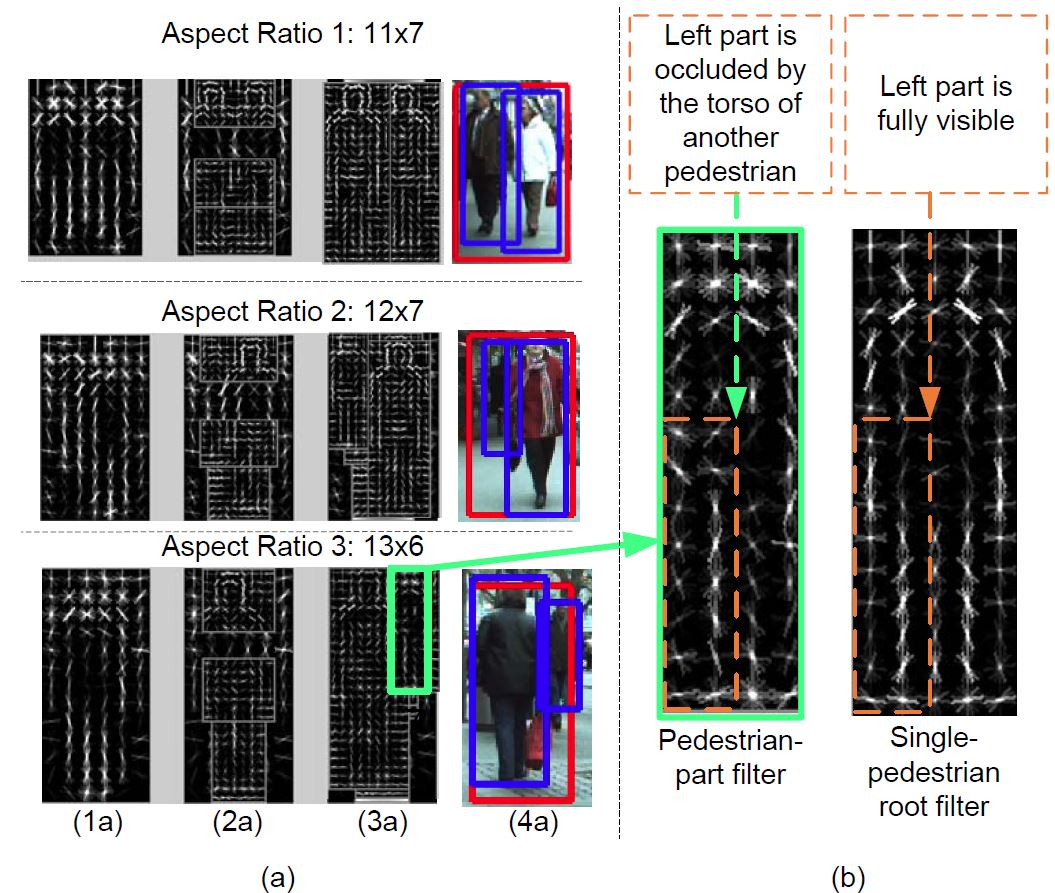
(a) Examples of 2-Pedestrian detectors learned for different clusters,
(b) pedestrian-part filter and the single-pedestrian root filter. (1a): root filter; (2a): three part filters found from root filter; (3a): pedestrian-part filters; (4a): examples detected by the detectors in the same rows. Red rectangles are 2-pedestrian detection results. Blue rectangles indicate pedestrian-part locations.
Miss rate improvement of the framework for each of the state-of-the-art 1-pedestrian detectors on Caltech-Test (left), TUDBrussels (middle) and ETH (right). X-axis denotes the miss rate improvement.
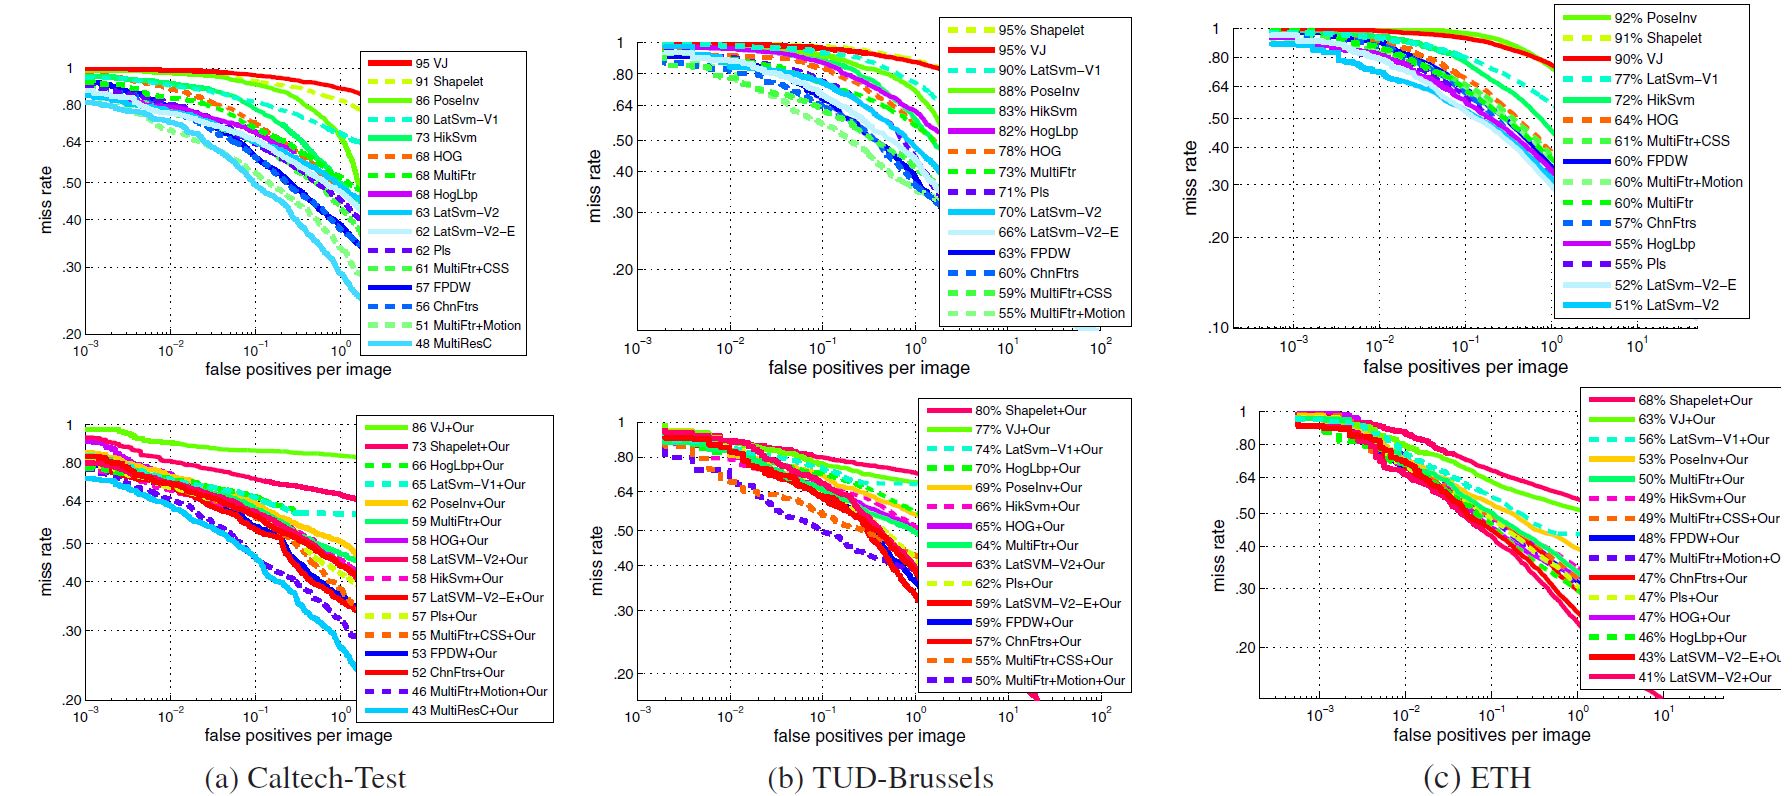
Detection results of existing approaches (top) and integrating them with our framework (bottom) on the datasets Caltech-Test (a), TUD-Brussels (b) and ETH (c). The results of integrating existing approaches with our framework are denoted by ’+Our’. For example, the result of integrating HOG with our framework is denoted by HOG+Our.


